Buoyant Cloud and Cortex: Standing on the shoulders of Linkerd and Prometheus
Buoyant, the creator of Linkerd, has had a close relationship with Prometheus and related technologies for years. As of today, that relationship now includes Cortex.
Linkerd is an open source service mesh for Kubernetes, and part of the CNCF, along with Prometheus and Cortex. Linkerd provides three key classes of features: observability, reliability, and security—all without requiring any changes to your code. That first pillar, observability, has motivated deep Prometheus integration, and is the focus of this case study.
Linkerd x Prometheus
In 2016, Linkerd 1.0 shipped with a visualization module built with Prometheus and Grafana. With the release of Linkerd 2.0 in 2018, Prometheus and Grafana were promoted to first-class components. That evolution was documented in a blog post entitled Prometheus the Right Way, and a KubeCon North America 2018 talk entitled Linkerd 2.0, Now with Extra Prometheus, both co-authored by Frederic Branczyk of Polar Signals and Andrew Seigner of Buoyant.
This deep integration in Linkerd 2.0 provided out-of-the-box golden metrics, that is, success rate, request rate, and latency, across all your Kubernetes workloads.
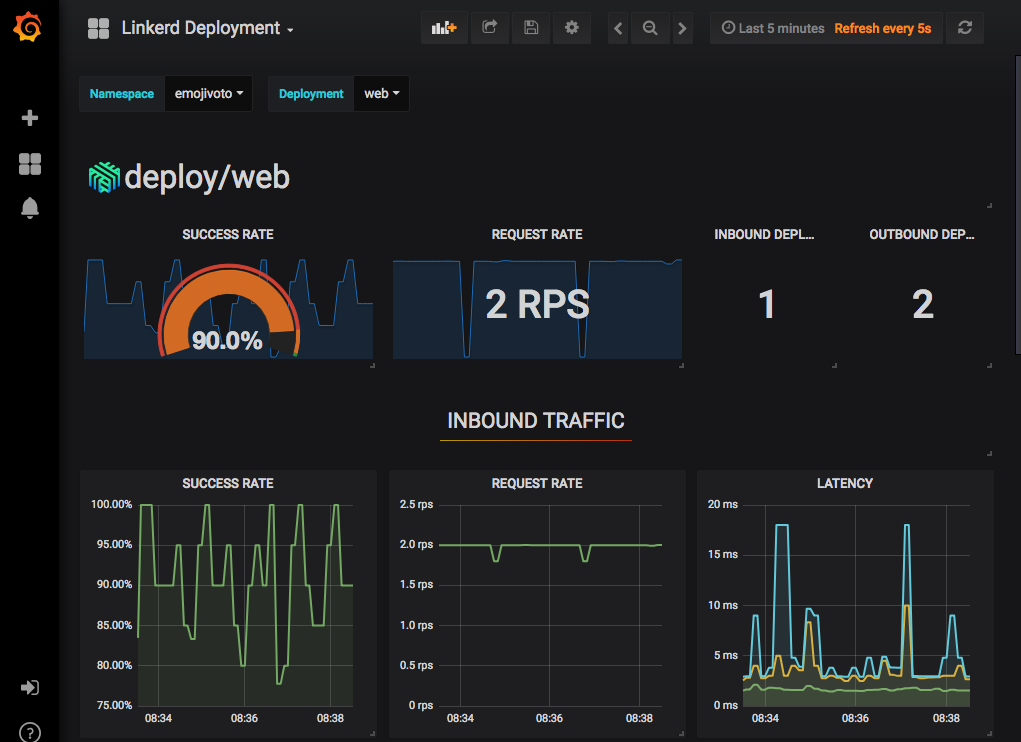 Linkerd 2.0 with integrated Prometheus and Grafana, out-of-the-box golden metrics
Buoyant x Cortex
Building on the success of Linkerd, Buoyant has created Buoyant Cloud, a global platform health dashboard for Kubernetes. Leveraging Linkerd’s integration with Prometheus, Buoyant Cloud rolls up Linkerd metrics across all Kubernetes clusters to provide global platform-wide observability, including advanced features such as cross-cluster Service Level Objectives for success rate and latency.
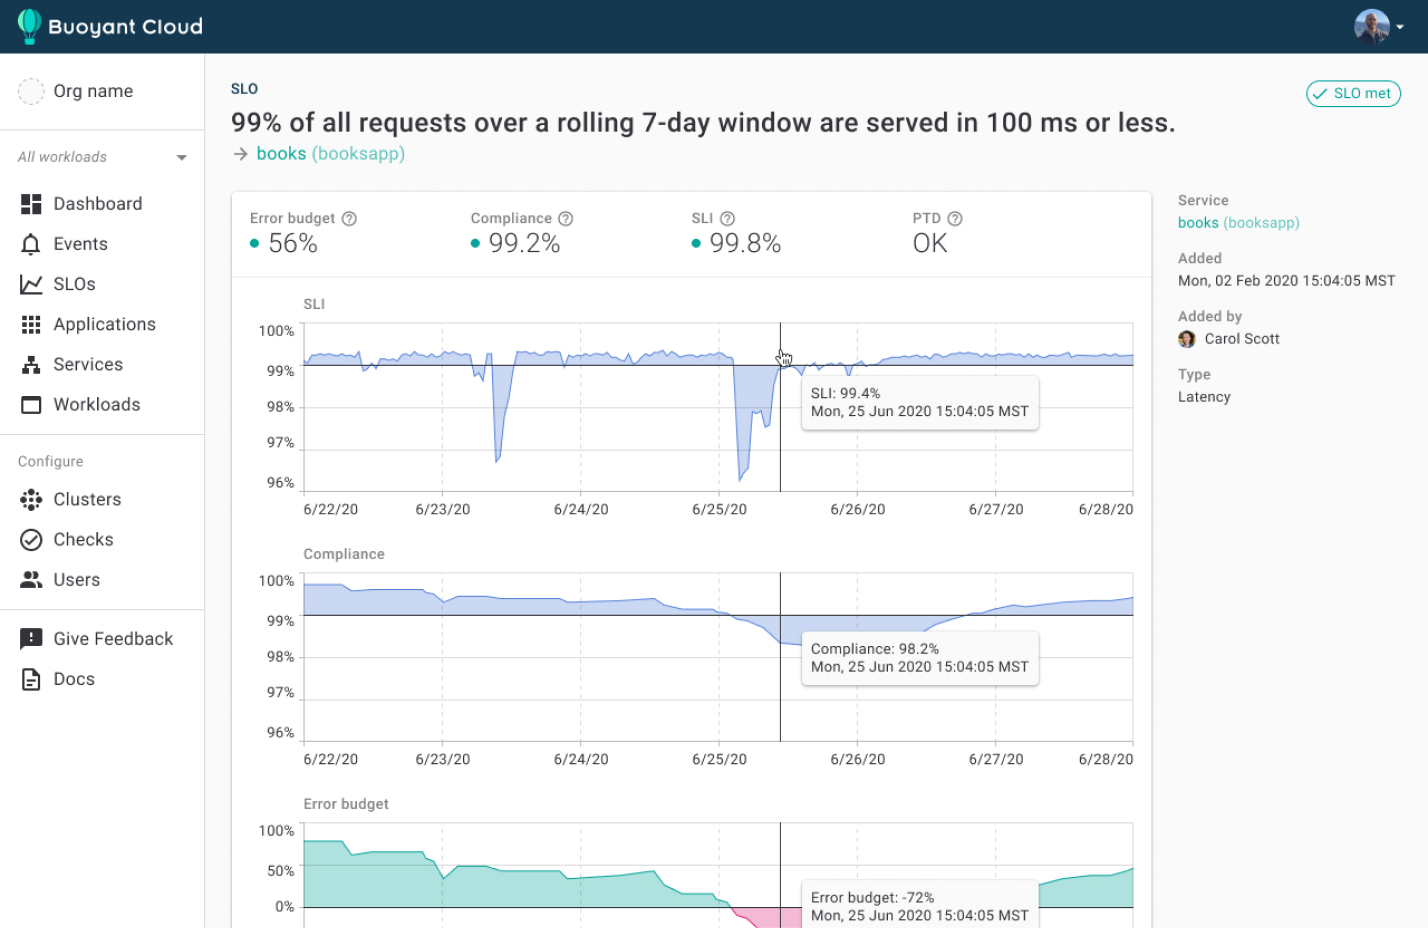 Service Level Objectives in Buoyant Cloud
Buoyant Cloud Prototyping with Prometheus
To enable observability in Buoyant Cloud, customers install an agent into their Kubernetes clusters. That agent gathers metrics from Linkerd and sends them up to Buoyant Cloud. Early prototypes of Buoyant Cloud received these metrics, wrote them to pushgateway, and then our own larger Prometheus would scrape metrics from there. While this had the nice property that Linkerd metrics looked the same in Buoyant Cloud as they did in individual Linkerd clusters, gathering metrics across all customers into a single Prometheus instance created an inherent scaling limitation, and a single-point-of-failure.
Observability Requirements
Thinking beyond our early prototypes, we came up with four core requirements for our observability system:
- Scalable - To support all Kubernetes clusters across our growing customer base, we needed a system that could scale as-needed. Bonus points if we could scale our reads and writes independently.
- Reliable - Users of Linkerd expect nothing less.
- Multi-tenant - To provide an extra layer of security and performance isolation between customers.
- Prometheus-compatible - To give our customers a familiar API, and to allow a drop-in replacement for our prototype Prometheus instance.
Those first two requirements in particular are not compatible with a single instance of anything. Even Prometheus, which does exceptionally well as a single instance, is intentionally not designed as a distributed, scalable system.
Take a look at those requirements again, then go to the Cortex website:
This was not intentional, but it was a fortuitous coincidence. Cortex’s one-line description of itself literally satisfied all four of our requirements for Buoyant Cloud.
Buoyant Cloud Production-Ready with Cortex
We set about building a proof of concept to validate whether Cortex could be a viable replacement for Buoyant Cloud’s prototype Prometheus-based observability.
Development environment
The very first attempt at Cortex integration in our development environment was surprisingly smooth, thanks largely to Cortex’s single instance, single process mode. This enabled our developers to operate all of Cortex’s services as a single process in our docker-compose development environment, with no dependencies.
(Almost) a drop-in replacement
Cortex provides a Prometheus-compatible API. To enable multi-tenancy, you must set a X-Scope-OrgID header on every request with a unique identifier for the tenant. We already had a unique public identifier for each Buoyant Cloud customer, so that was a natural fit for this header. Modifying all reads and writes to Prometheus to set this header was a relatively straightforward code change, considering we were about to completely swap out a back-end storage system.
Blocks Storage
Being the creators of Linkerd, we care a lot about operational complexity. Thus, it was no surprise that we wanted to minimize operational complexity and cost for ourselves in maintaining Buoyant Cloud. Cortex’s Chunk Storage was a concern here. Operating our own Cassandra cluster would incur developer time, and paying for DynamoDB, BigTable, or Azure Cosmos DB would incur cost. Cortex’s Blocks Storage removed this complexity and cost by relying on a simple and cheap object store, such as S3, GCS, or Azure Storage. At the time, Blocks Storage was still marked experimental. That’s when we hopped into a Q&A at a KubeCon EU 2020 talk, Scaling Prometheus: How We Got Some Thanos Into Cortex by Thor Hansen of HashiCorp and Marco Pracucci of Grafana Labs. We asked the Cortex maintainers how close to General Availability they felt Blocks Storage was. While wisely not guaranteeing a date, they hinted it may be ready by the next Cortex release (and that hint turned out to be true, Blocks Storage was marked stable in Cortex 1.4.0!). This gave us enough confidence to build our proof of concept around Blocks Storage.
Recording Rules
Buoyant Cloud uses recording rules for important success rate and latency metrics. One unexpected challenge was that Cortex’s multi-tenancy applies to recording rules. This meant that for every customer, we needed to push an identical set of recording rules to the Cortex Ruler API. We ended up writing a small background process that continually checks our database for new customers, and pushes recording rules when they appear.
Cortex in Prod: Writes, then reads
Once all the pieces were in place, we enabled production writes to our new Cortex cluster. We continued writing to and reading from our existing Prometheus. Writing to Cortex and Prometheus simultaneously enabled validation of three things. We could 1) Evaluate Cortex’s read performance under full production write load, 2) ensure Cortex query results matched Prometheus, and 3) gather enough historical metrics in Cortex to minimize data loss for our customers.
When we were satisfied with all three of these validation steps, we switched all reads to Cortex. This was the smallest code change in the entire migration. We simply swapped out a few command-line flags pointing to prometheus:9009 with query-frontend.cortex.svc.cluster.local:9009/api/prom. Boom! It all worked!
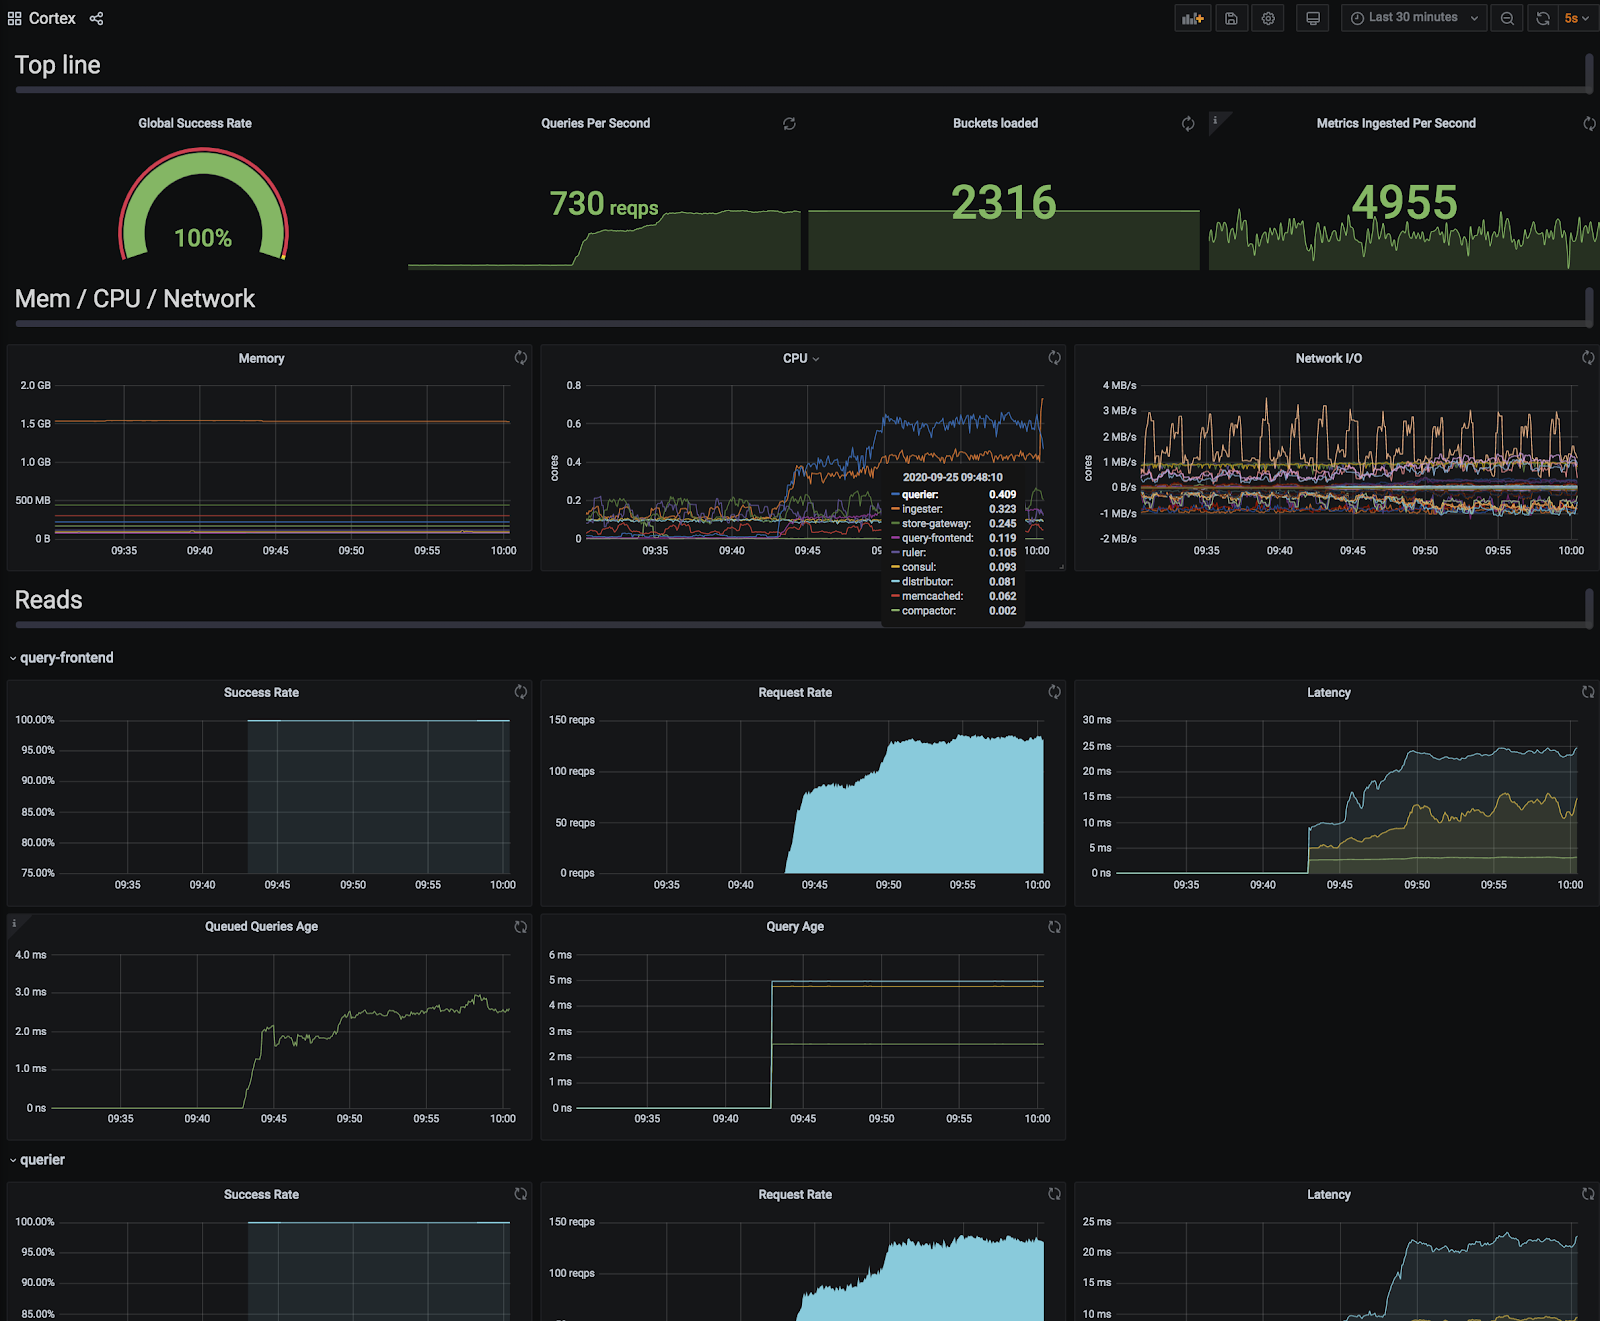 The moment we turned on Cortex reads in production (numbers do not reflect full production load).
Looking Ahead
Our mission with Buoyant Cloud is to enable our customers to build observable, scalable, and secure Kubernetes platforms, without the complexity of stitching together lots of components.
Users of Linkerd expect their observability to “just work”, and expect it to be something they are already familiar with and have tools to integrate with. For Linkerd running on a single Kubernetes cluster, Prometheus fits the bill perfectly. For Buoyant Cloud, we believe Cortex can deliver that same familiarity and integration story for all Kubernetes clusters across all customers.